【Python网络爬虫与数据可视化实战案例】近15年的中国国内生产总值

需求描述

  打开东方财富网的中国国内数据总值数据页,进入如下页面。
在这里插入图片描述
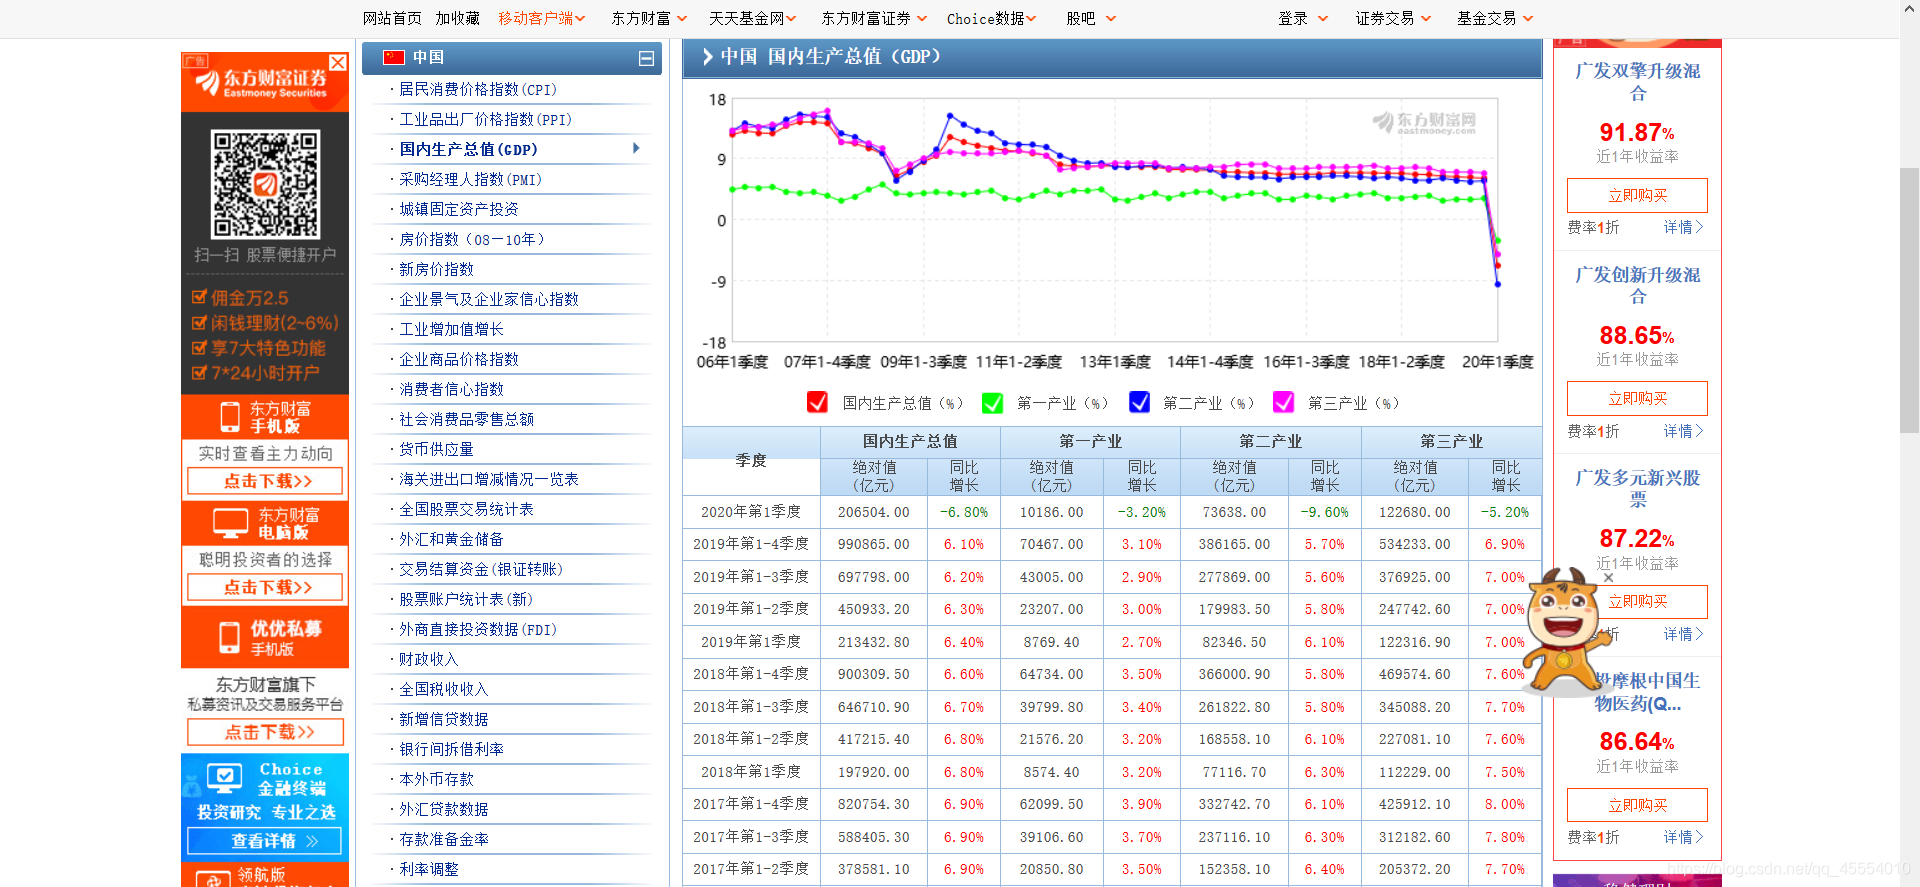
  现在需要把页面上的国内生产总值数据表爬取下来,写入CSV文件以持久化存储。在这之后,将CSV文件内的数据做成折线图,实现数据可视化。
  在爬取数据的过程中需要注意:数据表在该网页中分3页显示,我们需要在Python程序中实现换页的操作。

需求分析

  任意选取数据表中的一行,单击鼠标右键检查元素(这里我使用的是Firefox浏览器,不同浏览器可能略有不同)进入查看器。我们得到了下图所示的HTML结构。
在这里插入图片描述
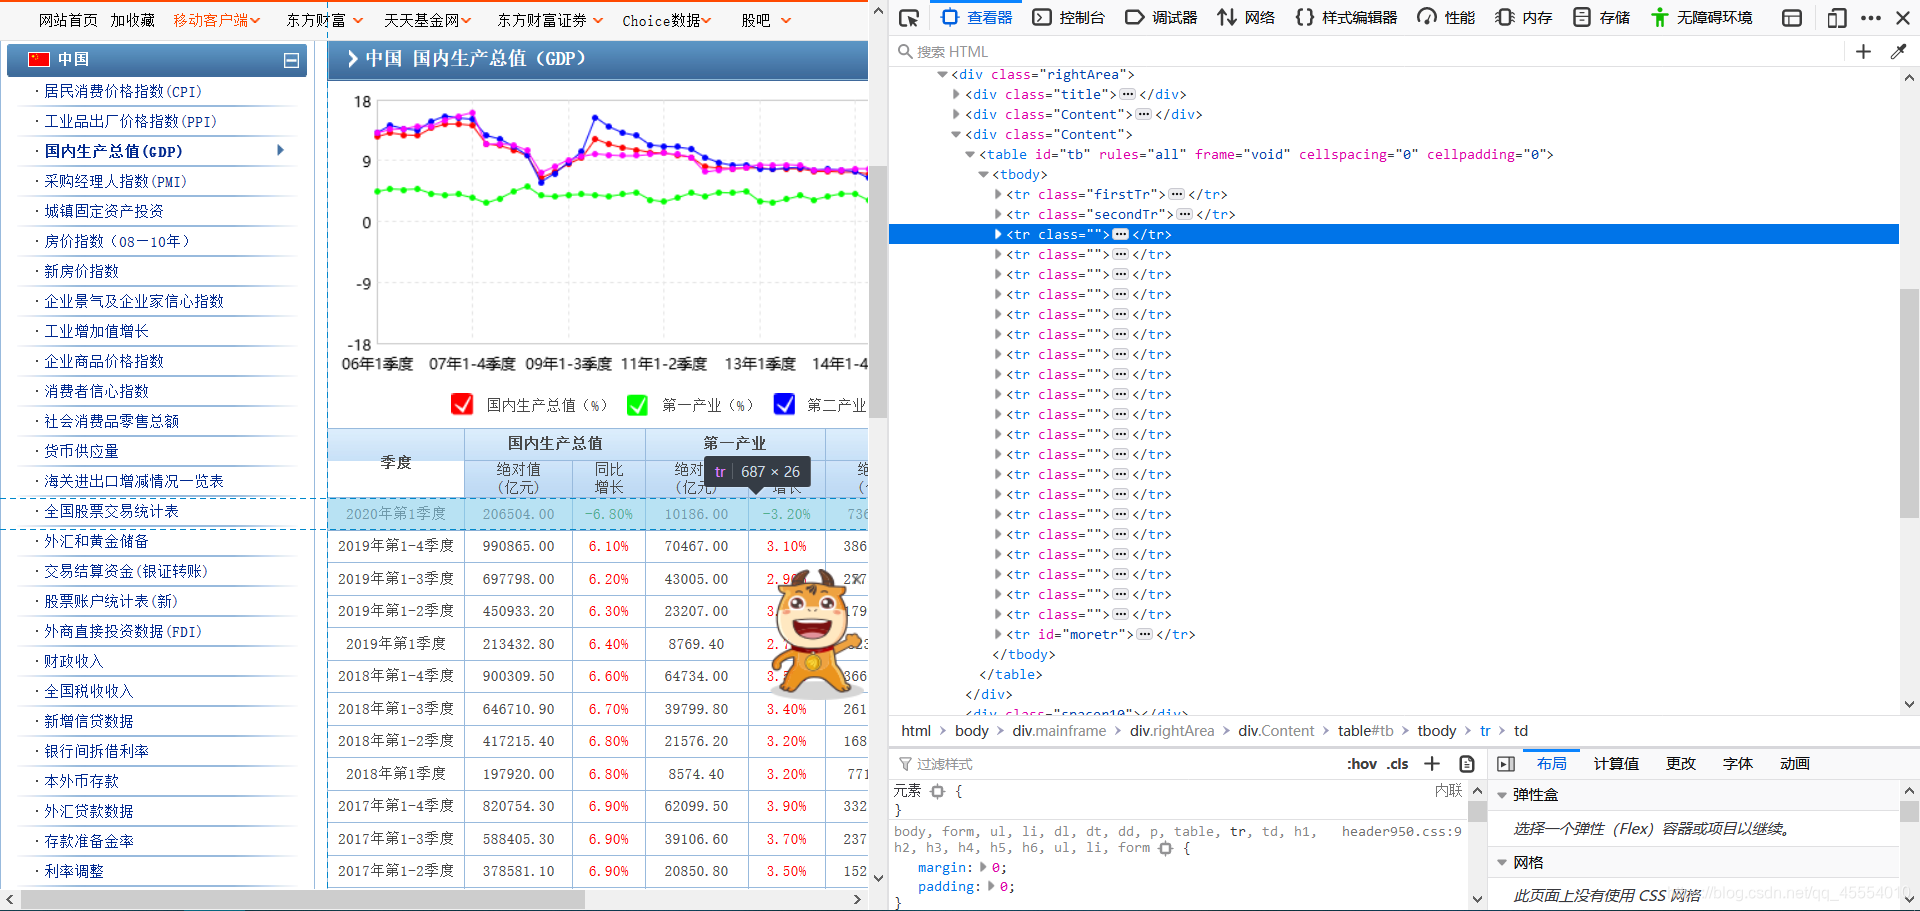
  这里我们很容易发现,数据表中每一列的信息都存储在table标签内的tr标签中。那么,我们只需要定位到这个标签,对该标签内的文本进行提取,即可获得数据表中的数据。
  下一个问题是如何实现换页操作。我们点击数据表下方的“下一页”,观察网址的变化。
在这里插入图片描述)在这里插入图片描述
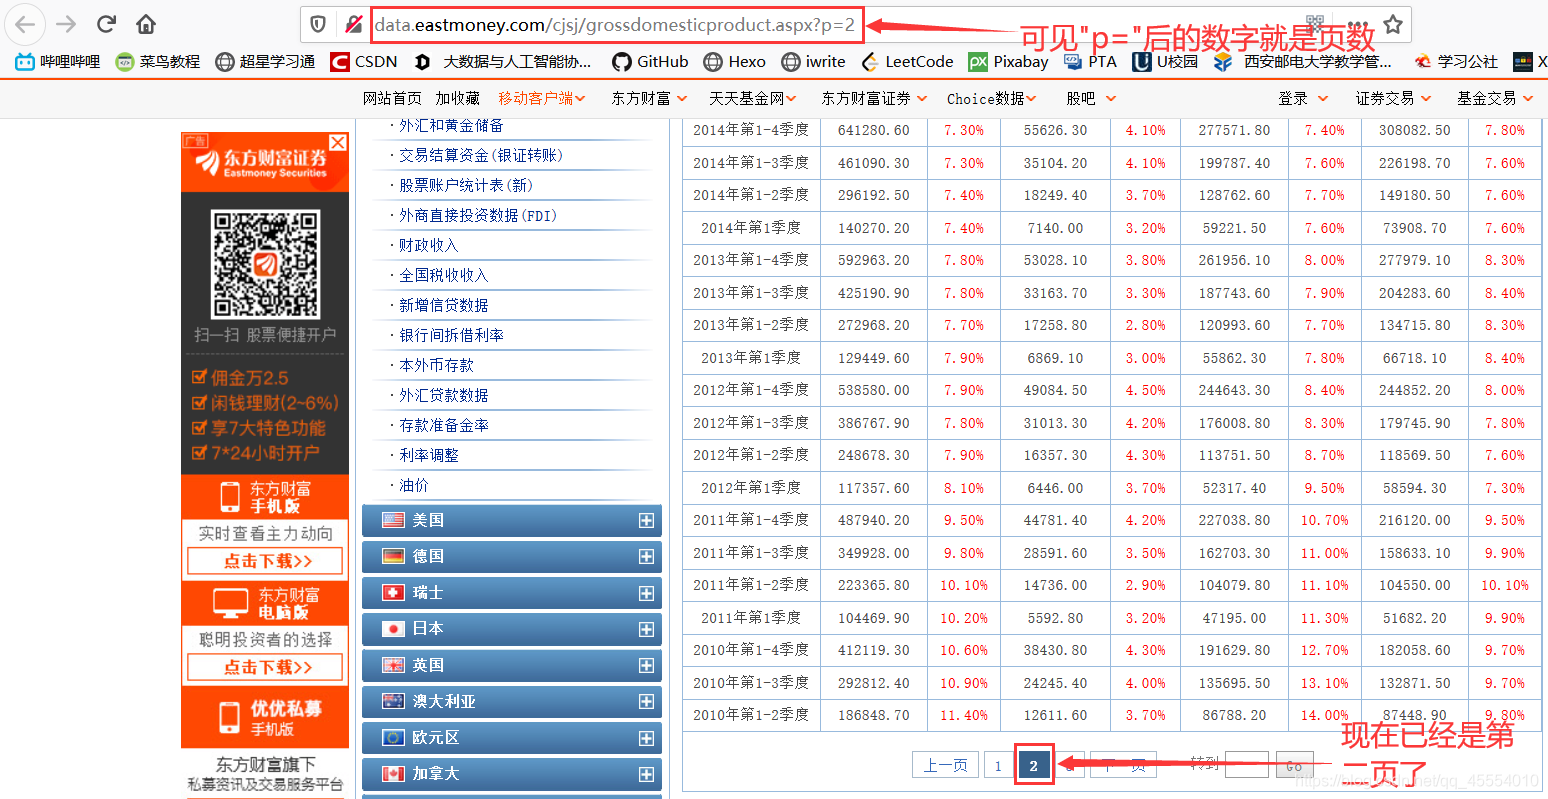
  网址只有“p=”后的数字发生了变化,其他的地方都没有改变。不难发现,“p=”后的数字所代表的就是当前的页数。

代码实现

1.数据爬取及持久化存储

  首先导入要用到的模块。

1
2
3
from bs4 import BeautifulSoup
import csv
import requests

  对网站发起请求,获取页面的数据。

1
2
3
4
5
6
headers = {'User-Agent': 'Mozilla/5.0 (Windows NT 10.0; Win64; x64; rv:75.0) Gecko/20100101 Firefox/75.0'}

for page in range(1, 4):
url = 'http://data.eastmoney.com/cjsj/grossdomesticproduct.aspx?p=' + str(page)
response = requests.get(url=url, headers=headers)
page_text = response.text

  使用bs4对爬取到的内容进行筛选,留下有用的数据。

1
2
3
4
5
6
7
8
9
10
soup = BeautifulSoup(page_text, 'html.parser')
table = soup.find('table', id='tb')
tr_list = table.find_all('tr')
tr_list.pop(-1)
for i in range(2):
tr_list.pop(0)

for tr in tr_list:
info = tr.text.replace(' ', '').replace('\r', '').replace('\n', ' ').lstrip().rstrip()
info_list = info.split()

  持久化存储,将数据写入CSV文件。
  首先写入标题行。

1
2
3
4
5
with open('中国国内生产总值.csv', 'w', newline='') as csv_out_file:
head_list = ['季度', '国内生产总值-绝对值(亿元)', '国内生产总值-同比增长', '第一产业-绝对值(亿元)', '第一产业-同比增长',
'第二产业-绝对值(亿元)', '第二产业-同比增长', '第三产业-绝对值(亿元)', '第三产业-同比增长']
filewriter = csv.writer(csv_out_file)
filewriter.writerow(head_list)

  写入其余的数据行。

1
2
with open...:
filewriter.writerow(info_list)

  重构代码后,完整代码如下:

1
2
3
4
5
6
7
8
9
10
11
12
13
14
15
16
17
18
19
20
21
22
23
24
25
26
27
28
29
30
#!/usr/bin/env python3

from bs4 import BeautifulSoup
import csv
import requests

headers = {'User-Agent': 'Mozilla/5.0 (Windows NT 10.0; Win64; x64; rv:75.0) Gecko/20100101 Firefox/75.0'}

with open('中国国内生产总值.csv', 'w', newline='') as csv_out_file:
head_list = ['季度', '国内生产总值-绝对值(亿元)', '国内生产总值-同比增长', '第一产业-绝对值(亿元)', '第一产业-同比增长',
'第二产业-绝对值(亿元)', '第二产业-同比增长', '第三产业-绝对值(亿元)', '第三产业-同比增长']
filewriter = csv.writer(csv_out_file)
filewriter.writerow(head_list)

for page in range(1, 4):
url = 'http://data.eastmoney.com/cjsj/grossdomesticproduct.aspx?p=' + str(page)
response = requests.get(url=url, headers=headers)
page_text = response.text

soup = BeautifulSoup(page_text, 'html.parser')
table = soup.find('table', id='tb')
tr_list = table.find_all('tr')
tr_list.pop(-1)
for i in range(2):
tr_list.pop(0)

for tr in tr_list:
info = tr.text.replace(' ', '').replace('\r', '').replace('\n', ' ').lstrip().rstrip()
info_list = info.split()
filewriter.writerow(info_list)
2.数据可视化

  这一部分比较简单。首先导入需要的模块。

1
2
import csv
from pyecharts import Line

  读取CSV文件中的数据,并对其进行处理。

1
2
3
4
5
6
7
8
9
10
11
12
13
14
15
16
17
18
19
Quarter = []
GDP = []
Primary_industry = []
Secondary_industry = []
Tertiary_industry = []

with open('中国国内生产总值.csv', 'r', newline='') as csv_in_file:
filereader = csv.reader(csv_in_file)
head = next(filereader)
for row_list in filereader:
Quarter.append(row_list[0])
gdp = round(eval(row_list[2][:-1]) / 100, 3)
GDP.append(gdp)
pri = round(eval(row_list[4][:-1]) / 100, 3)
Primary_industry.append(pri)
sec = round(eval(row_list[6][:-1]) / 100, 3)
Secondary_industry.append(sec)
ter = round(eval(row_list[8][:-1]) / 100, 3)
Tertiary_industry.append(ter)

  接下来是需要注意的一点。网站上的数据是根据时间排序的,2020年的数据在最前面,2006年的数据在最后面。即网站上的数据是根据时间“由近及远”排序的。在这里我们需要将处理好的数据列表进行逆序处理。

1
2
3
4
5
Quarter = Quarter[::-1]
GDP = GDP[::-1]
Primary_industry = Primary_industry[::-1]
Secondary_industry = Secondary_industry[::-1]
Tertiary_industry = Tertiary_industry[::-1]

  最后一步是数据可视化,利用pyecharts绘制折线图。
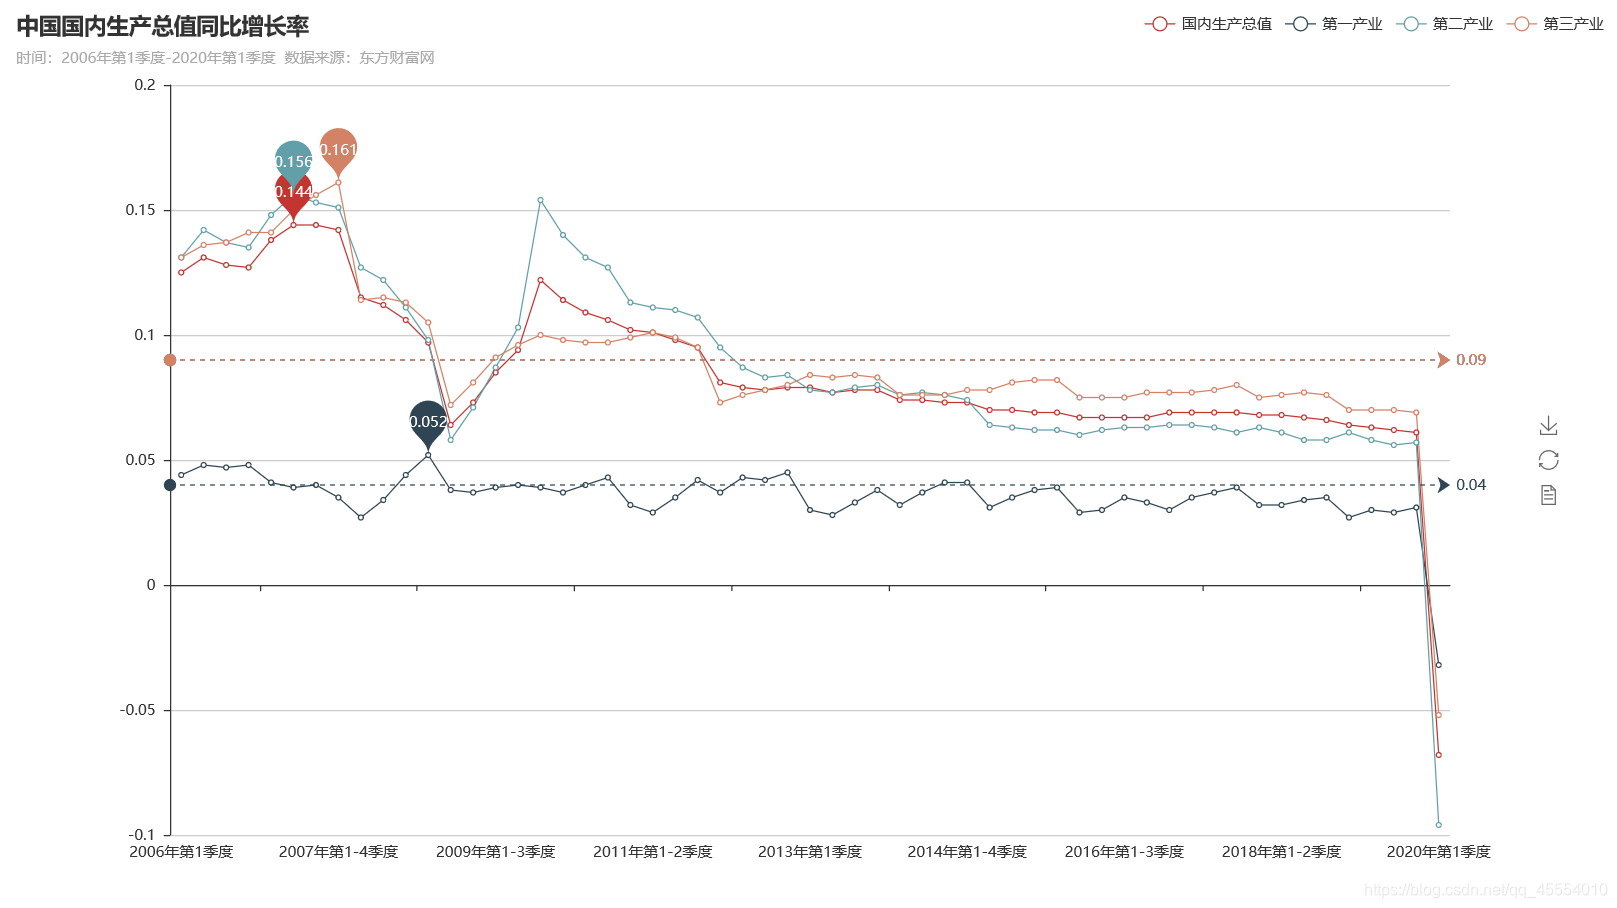
1
2
3
4
5
6
7
8
9
line = Line('中国国内生产总值同比增长率', '时间:2006年第1季度-2020年第1季度  数据来源:东方财富网', width=1280, height=720)
line.add('国内生产总值', Quarter, GDP, is_smooth=False, mark_point=['max'], mark_line=['average'], legend_pos='right')
line.add('第一产业', Quarter, Primary_industry, is_smooth=False, mark_point=['max'], mark_line=['average'],
legend_pos='right')
line.add('第二产业', Quarter, Secondary_industry, is_smooth=False, mark_point=['max'], mark_line=['average'],
legend_pos='right')
line.add('第三产业', Quarter, Tertiary_industry, is_smooth=False, mark_point=['max'], mark_line=['average'],
legend_pos='right')
line.render('中国国内生产总值.html')

  完整代码如下:

1
2
3
4
5
6
7
8
9
10
11
12
13
14
15
16
17
18
19
20
21
22
23
24
25
26
27
28
29
30
31
32
33
34
35
36
37
38
39
40
#!/usr/bin/env python3

import csv
from pyecharts import Line

Quarter = []
GDP = []
Primary_industry = []
Secondary_industry = []
Tertiary_industry = []

with open('中国国内生产总值.csv', 'r', newline='') as csv_in_file:
filereader = csv.reader(csv_in_file)
head = next(filereader)
for row_list in filereader:
Quarter.append(row_list[0])
gdp = round(eval(row_list[2][:-1]) / 100, 3)
GDP.append(gdp)
pri = round(eval(row_list[4][:-1]) / 100, 3)
Primary_industry.append(pri)
sec = round(eval(row_list[6][:-1]) / 100, 3)
Secondary_industry.append(sec)
ter = round(eval(row_list[8][:-1]) / 100, 3)
Tertiary_industry.append(ter)

Quarter = Quarter[::-1]
GDP = GDP[::-1]
Primary_industry = Primary_industry[::-1]
Secondary_industry = Secondary_industry[::-1]
Tertiary_industry = Tertiary_industry[::-1]

line = Line('中国国内生产总值同比增长率', '时间:2006年第1季度-2020年第1季度 数据来源:东方财富网', width=1280, height=720)
line.add('国内生产总值', Quarter, GDP, is_smooth=False, mark_point=['max'], mark_line=['average'], legend_pos='right')
line.add('第一产业', Quarter, Primary_industry, is_smooth=False, mark_point=['max'], mark_line=['average'],
legend_pos='right')
line.add('第二产业', Quarter, Secondary_industry, is_smooth=False, mark_point=['max'], mark_line=['average'],
legend_pos='right')
line.add('第三产业', Quarter, Tertiary_industry, is_smooth=False, mark_point=['max'], mark_line=['average'],
legend_pos='right')
line.render('中国国内生产总值.html')

结果展示

  保存有近15年中国GDP数据的CSV文件如下图所示:
在这里插入图片描述
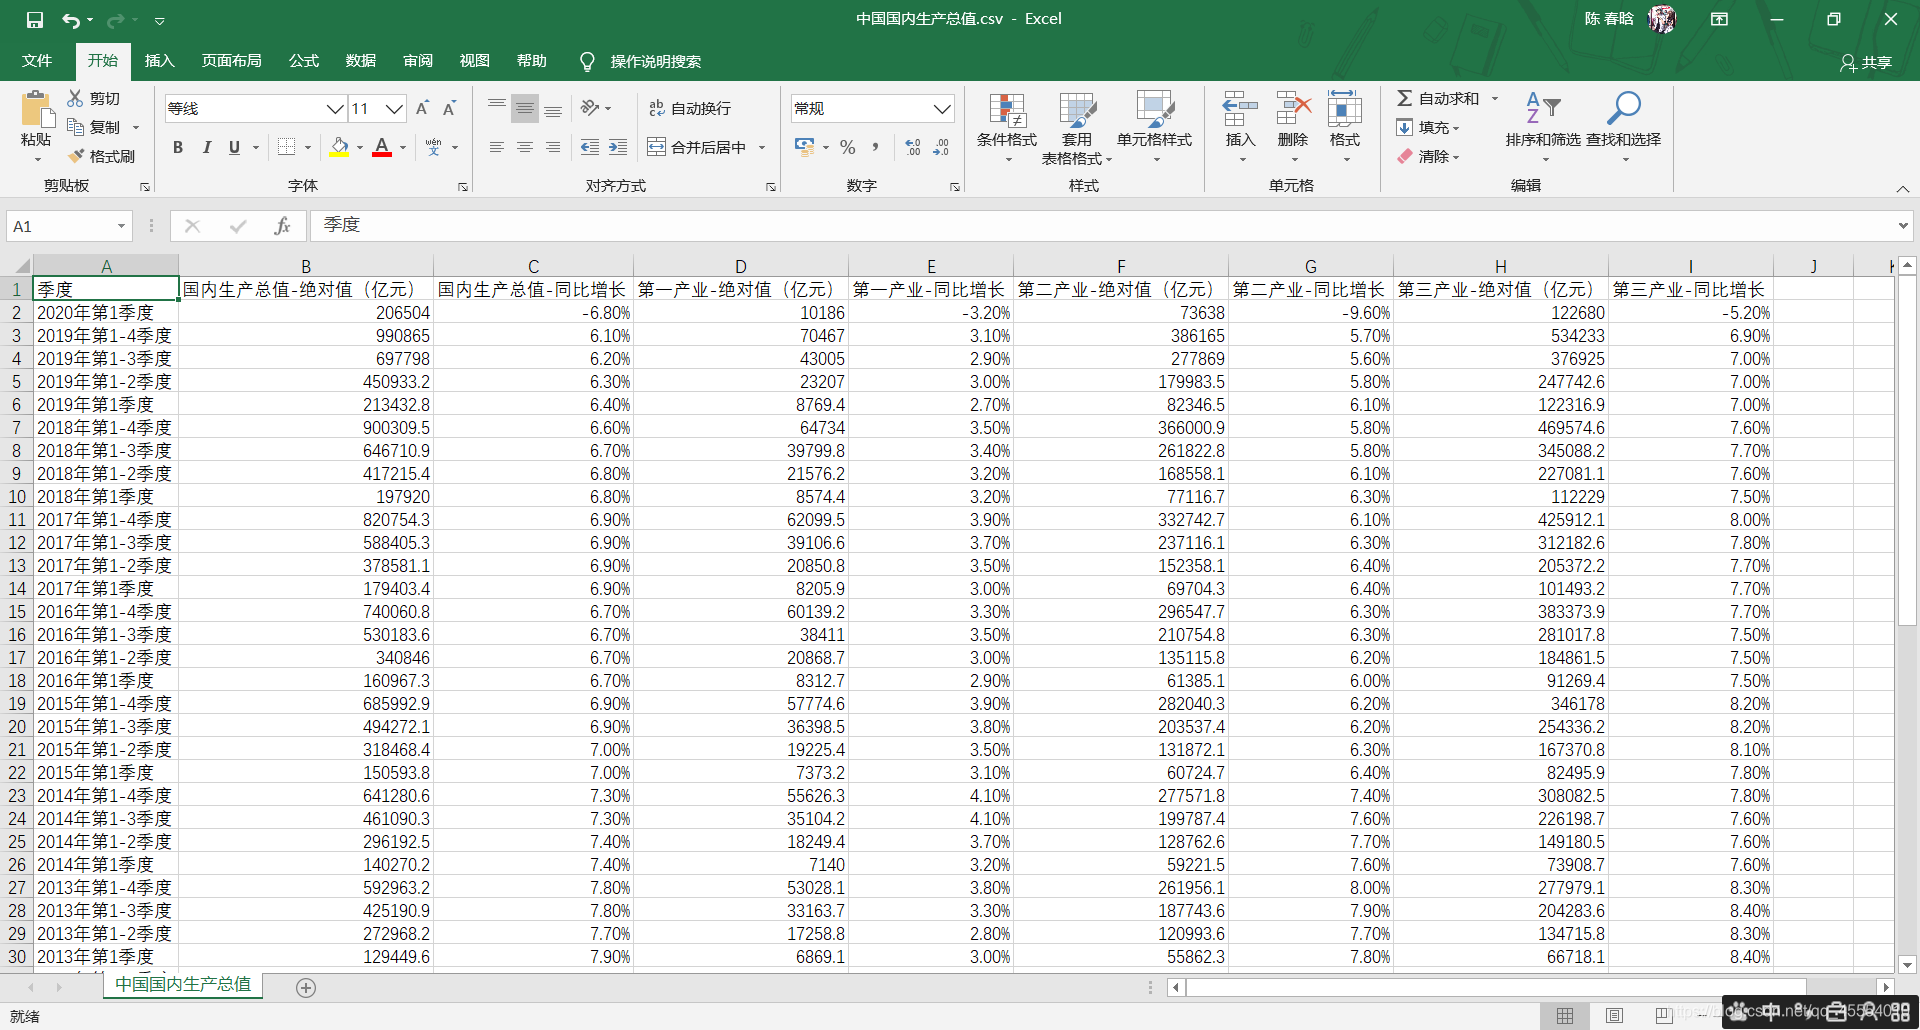
  绘制的折线图如下图所示(注:国内生产总值、第二产业、第三产业的平均值恰好都为0.09,故平均值线重合):
在这里插入图片描述